Principles of Microeconomics · Lecture 11
In this lesson
- Specialization by Comparative Advantage Makes Two People Richer Together
- A Cheaper Newcomer Spreads Gains Across the Whole Economy
- Blocking a Cheaper Producer Protects the Few at the Expense of the Many
- Specialization Has Two Meanings, and Both Make Us Richer
- Bigger Markets Allow Finer Specialization and Cheaper Production
- For Further Reading
Specialization and Exchange
Part A built the machinery: cost is opportunity cost, the best thing you give up, and marginal cost rises in Adam’s short-run schedule as he bakes faster, so a self-producer makes a good only up to where its worth meets its cost. It also turned up a loose thread. In the two-person, two-good model, cost in one good is the flip side of cost in the other: if one person has the lower relative cost of one good, the other has it in the other good. That resolves the puzzle from the exchange topic: you can be worse at producing everything than the person next to you and still have something worth selling to them. With many people and goods, however, a particular person need not be the lowest-cost supplier of anything in that market.
Part B pulls that thread. We take the gap in costs and watch how specialization and exchange can make both participants better off even when one is worse at making everything. We then ask what survives outside the two-person model: who gains and loses from entry, when specialization lowers cost, and what must be true before an entry restriction can be judged harmful.
Figure focus. Required: comparative costs and the Ana/Ben PPF. Others are references unless assigned.
Specialization by Comparative Advantage Makes Two People Richer Together
Here is the payoff. People differ in what it costs them to make things; watch what that lets them do. Bring back Adam, the cake-maker from Part A, and introduce Baker, the less talented of the two: working alone, he makes fewer cakes per day than Adam and fewer of the other goods, the basket whose dollar value we bundled together and called Y, as well. Adam has an absolute advantage in both. By the lazy intuition, Baker has nothing to offer.
He does. Put their cost tables side by side. Recall Adam’s first: each row is a production rate in cakes per day, with the cost in Y he gives up and the most Y he would give up to have one more cake.
| Cakes per day | Adam’s total cost (in Y) | Adam’s marginal cost (next cake, in Y) | Adam’s average cost (per cake, in Y) | Adam’s marginal worth of the cake (in Y) |
|---|---|---|---|---|
| 0 | – | – | – | – |
| 1 | 0.90 | 0.90 | 0.90 | 1.15 |
| 2 | 1.90 | 1.00 | 0.95 | 1.05 |
| 3 | 3.00 | 1.10 | 1.00 | 0.95 |
| 4 | 4.20 | 1.20 | 1.05 | 0.85 |
| 5 | 5.50 | 1.30 | 1.10 | 0.75 |
| 6 | 6.90 | 1.40 | 1.15 | 0.65 |
| 7 | 8.40 | 1.50 | 1.20 | 0.55 |
| 8 | 10.00 | 1.60 | 1.25 | 0.45 |
Table A. Adam’s cost of cakes, the same schedule built in Part A, now lined up against Baker’s below. His marginal cost of a cake rises as he bakes faster, and the worth of each additional cake to him falls.
Now Baker’s.
| Cakes per day | Baker’s total cost (in Y) | Baker’s marginal cost (next cake, in Y) | Baker’s average cost (per cake, in Y) | Baker’s marginal worth of the cake (in Y) |
|---|---|---|---|---|
| 0 | – | – | – | – |
| 1 | 0.40 | 0.40 | 0.40 | 0.90 |
| 2 | 1.00 | 0.60 | 0.50 | 0.80 |
| 3 | 1.80 | 0.80 | 0.60 | 0.70 |
| 4 | 2.80 | 1.00 | 0.70 | 0.60 |
| 5 | 4.00 | 1.20 | 0.80 | 0.50 |
| 6 | 5.40 | 1.40 | 0.90 | 0.40 |
| 7 | 7.00 | 1.60 | 1.00 | 0.30 |
| 8 | 8.80 | 1.80 | 1.10 | 0.20 |
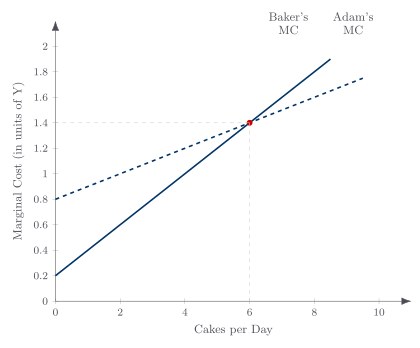
Table 5. Baker is absolutely worse than Adam, yet over the first five cakes his marginal cost of a cake is lower than Adam’s. He is the cheaper maker of the early cakes; Adam, whose marginal cost rises more slowly at higher rates, becomes the cheaper maker only past six cakes a day.
Compare the marginal-cost columns. For the first cake, Baker gives up 0.40Y while Adam gives up 0.90Y. Baker is the cheaper cake-maker over the early units, even though he is worse at everything. His marginal cost climbs faster than Adam’s, and the two cross at six cakes a day; beyond that, Adam is cheaper. But in the range where the early cakes get made, Baker is the low-cost producer. There it is again: worse at everything, yet the cheaper maker of something. Do not read that as Baker out-producing Adam: being the cheaper maker of a cake and being able to make more cakes are separate questions. Cost per unit tells you what a producer gives up for the next unit, not how many units he can turn out, and Baker’s own daily totals stay lower than Adam’s throughout.
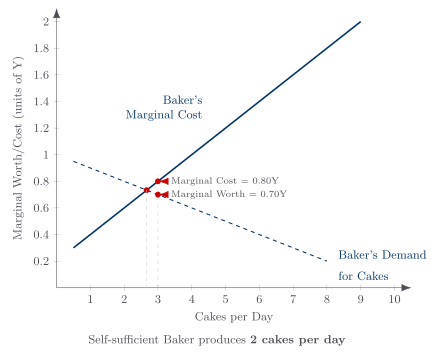
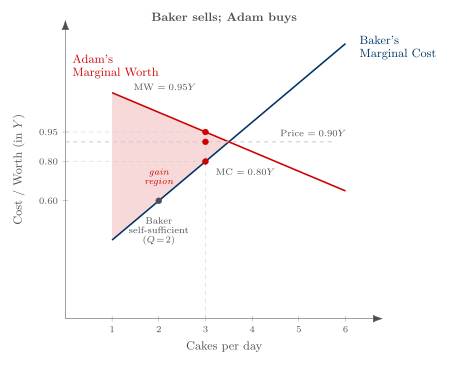
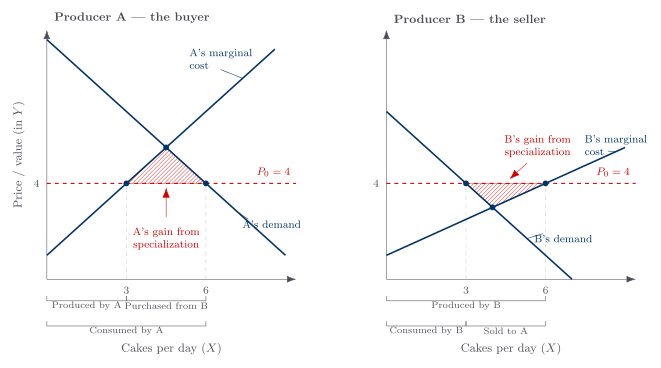
Left alone, each man makes two cakes for himself, where his rising cost catches up to his falling worth. Now let them cooperate. Adam would dearly like a third cake, but making it himself would cost 1.10Y while it is worth only 0.95Y to him, so he forgoes it. Baker would not bake a third for himself either, since it would cost him 0.80Y and be worth only 0.70Y. But here is the opening: Baker can make that third cake for 0.80Y and sell it to Adam, for whom it is worth 0.95Y. At any price between those two numbers both gain; say they settle on 0.90Y. Baker collects 0.90 for a cake that cost him 0.80; Adam pays 0.90 for a cake worth 0.95 to him. On their own the two of them made and ate four cakes; by specializing and trading, they enjoy five. No new talent appeared. They simply let the lower-cost producer make the extra unit. That gap in their marginal costs is the engine, exactly as a gap in their worths drove the trades we studied earlier. People trade on differences, whether the difference is in what they value or in what it costs them to produce.
What actually tells each producer which good to specialize in is the comparison of relative prices to relative marginal costs. Picture a farmer who can grow oats or soybeans and gives up five oats for every soybean, so a soybean costs him five oats to make. If a soybean sells for more than five times the price of oats, the stated comparison favors soybeans; if it sells for less, it favors oats. He switches at the price ratio equal to his cost ratio. With rising costs he may produce some of both rather than specialize completely, and capacity, trade costs, risk, joint production, or other constraints can change the feasible pattern. Relative prices still coordinate the benchmark choice without assigning him a crop, but comparative advantage identifies a potential direction of gain, not a unique real-world production plan by itself.
A frontier diagram makes the same point in a different register.
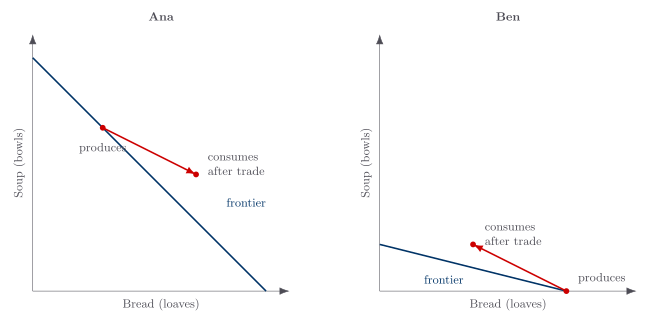
Trade lets each person consume beyond his own production frontier. Ana is better at making both goods, yet Ben, who is worse at everything, still gains: by specializing in what he gives up least to make and trading for the rest, each ends up at a consumption point outside the boundary he could reach alone.
A Cheaper Newcomer Spreads Gains Across the Whole Economy
So far it is two people. To isolate entry while holding the other conditions fixed, add a third producer, Carter, to the Adam-and-Baker world. Carter can make a third cake more cheaply than Baker can; where Baker’s third cake costs 0.80Y, Carter’s costs less. If the cakes are comparable and switching is not too costly, Carter can offer Adam a cake below Baker’s cost and Adam buys from him.
| Cakes per day | Carter’s total cost (in Y) | Carter’s marginal cost (next cake, in Y) | Carter’s average cost (per cake, in Y) | Carter’s marginal worth of the cake (in Y) |
|---|---|---|---|---|
| 0 | – | – | – | – |
| 1 | 0.20 | 0.20 | 0.20 | 0.50 |
| 2 | 0.60 | 0.40 | 0.30 | 0.40 |
| 3 | 1.20 | 0.60 | 0.40 | 0.30 |
| 4 | 2.00 | 0.80 | 0.50 | 0.20 |
| 5 | 3.00 | 1.00 | 0.60 | 0.10 |
Table 6. Carter can make the early cakes more cheaply than Baker, so when he is allowed in, he undercuts Baker on the cake sold to Adam.
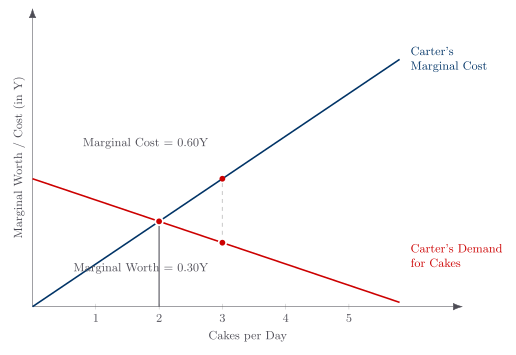
Trace who wins and who loses, because this is where economics earns its reputation for uncomfortable truths. In the stated model, Adam gains: he gets his cake at a lower price. Carter gains: he earns income he did not have before. Baker loses: he is pushed back to two cakes and gives up the income he earned on the third. Part of Adam’s gain is a transfer from Baker, one person’s loss becoming another’s saving. The net addition is the cost saving: Baker’s released resources can make 0.80Y of other goods, while Carter’s cake uses up only 0.60Y, so the economy gains 0.20Y, minus transition, search, transaction, and any omitted quality or spillover costs. It is positive in this numerical example because those costs are assumed away; that does not mean every affected person gains.
The people who get hurt are always the existing producers, the competitors of the newcomer, and their loss is real. If Baker’s freed-up resources are people, they have to find new work, perhaps at lower pay for a while. That is why the next idea is the seed of nearly everything we will say about policy.
And before we get there, notice what can happen to the newcomer’s profit. If the method can be copied, entry is open, and capacity can expand, competition among suppliers tends to pull price toward sustainable cost and pass more of the saving to buyers. Patents, scarce inputs, switching costs, scale economies, or slow entry can make that process incomplete or delayed. Exactly how competition works is a story this course takes up when we turn to the competitive firm.
Blocking a Cheaper Producer Protects the Few at the Expense of the Many
What if Baker can stop Carter from entering? He has an incentive to try, and he can dress it up nicely: “Keep the jobs at home.” “Don’t let cheap outsiders flood the market.” Suppose he persuades the authorities to bar Carter, whether Carter is a foreign seller or a newcomer down the street. In the model, the result is a higher price for Adam, protected income for Baker, and loss of the output Carter’s lower cost would have released. That is a net loss when the restriction supplies no offsetting benefit. A real policy comparison must also count any credible effect on safety, quality information, rights, enforcement, or other spillovers, then compare it with less restrictive ways to obtain that benefit.
This is the logic behind occupational licensing, licensing’s most common form in the chapter’s examples. A rule that grants a license only when existing supply is judged “inadequate” directly protects incumbents by conditioning entry on their market position. Training, examination, or disclosure requirements can instead help buyers assess quality or reduce harm, but they also raise entry and compliance costs; whether their benefit justifies those costs is an empirical and institutional question. The design matters. A narrowly tailored certification or inspection regime may preserve more entry than a blanket prohibition, while an incumbent-controlled board has a stronger route to protection.
There is a political puzzle buried here that runs through the rest of the course. When a cheaper producer is blocked, incumbents may each have a large stake while buyers each bear a small one, making the former easier to organize. That mechanism does not guarantee victory: salience, institutions, evidence, ideology, and countervailing groups also matter. It does explain why some costly protections can persist. In the benchmark, a cheaper entrant differs from a thief because the entrant releases resources for other production rather than merely transferring an existing good; whether a particular entrant creates a net gain depends on counting all relevant effects.
Specialization Has Two Meanings, and Both Make Us Richer
So far “specialization” has meant one thing: letting the lower-cost producer make a good rather than each person making a little of everything. Specializing means producing more of some things than you personally use and obtaining the rest from others. When exchange is reliable and its full cost is below the opportunity-cost saving, this avoids costly self-sufficiency. Dependence on suppliers, disruption risk, bargaining exposure, and adjustment costs are real counterweights, so the economic question is how far to specialize, not whether maximum specialization is always best.
But specialization has a second meaning. Doing the same task over and over makes you better at it in the source’s simplified statement; more precisely, repetition can improve performance at a suitable task through learning by doing. The surgeon who performs one operation many times can develop expertise a generalist lacks, and a printer can spread specialized equipment over many customers. The effect is not automatic: fatigue, narrow skill, coordination failures, or a changing technology can offset it. Learning is therefore a possible source of falling cost, distinct from initially sorting work by comparative advantage.
Bigger Markets Allow Finer Specialization and Cheaper Production
Market size is one condition governing how far specialization can go. The bigger the market you can sell into, the more finely you can specialize in the benchmark, because there may be enough customers to cover a narrow specialty’s fixed investment. Transport, communication, contracting, and trust determine how much of the nominal market is actually reachable.
Picture a small town with one doctor. The local patient base may not keep a knee specialist busy, while a large city can fill several specialists’ schedules. Density and access can therefore deepen specialization. They do not prove that every specialist is better than every generalist or that size alone caused an economy’s income; selection, institutions, capital, knowledge, and infrastructure also matter.
Larger volume can also make a high-fixed-cost, low-marginal-cost technique worthwhile. That is why standardized products are often cheaper than custom ones. But scale economies can be exhausted or reversed by coordination cost, congestion, or capacity limits. A law forbidding car sales across state lines would tend to sacrifice some volume and specialization if it genuinely fragmented the market; the size of the price effect would depend on existing plant scale, trade costs, and substitution among sellers.
For Further Reading
Want to explore the source material? This lecture draws on the following chapters from two books by Armen A. Alchian and William R. Allen:
- Universal Economics (Liberty Fund, 2018): Ch. 15, “Specialization and Exchange”.
- Exchange and Production, 3rd ed. (Wadsworth, 1983): Ch. 7, “Production with Specialization”.
Key takeaways
- Comparative advantage identifies potential gains from a different production pattern. In the two-person example, the lower-cost producer makes an extra unit and trades it at a price between cost and marginal worth; both gain even though one is worse at everything.
- Entry has both efficiency and distributional effects. A lower-cost entrant can release resources for other output while hurting incumbents. An entry restriction is a net loss only after any credible quality, information, safety, rights, or enforcement benefit is counted.
- Specialization has benefits and limits. Sorting by comparative advantage, learning by doing, and a market large enough to support specialized methods can lower cost; dependence, transaction costs, risk, capacity, and coordination determine how far specialization should go.